Summer 2010 - how hot was it?
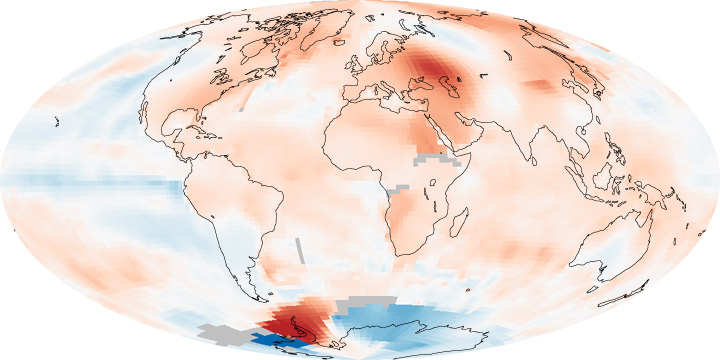
As summer seems to linger on even into October, many people are commenting on how hot it was. Worldwide, this has been a long summer - fourth hottest June-July-August on record, although it might be better charcterized as a summer of extremes, rather than ubiquitously hot. The summary map of global temperatures for June to August by NOAA shows a range of effects:
![]()
As in the July summary (below), the heatwave in Russia is a prominent
anomaly, if less pronounced now that more normal conditions have
resumed. Almost all of Eurasia and Africa were at least 1 degree warmer,
with the exception of central Siberia, where the jet stream looped
south, and over Pakistan and eastern China - areas cooled by the heavy
precipitation and floods there. Prominent anomalies exist over
Antarctica (both hot and cold), but not also the growing extent of cool
water in the Pacific as La Nina builds.
1 October 2010
Earthquake in New Zealand
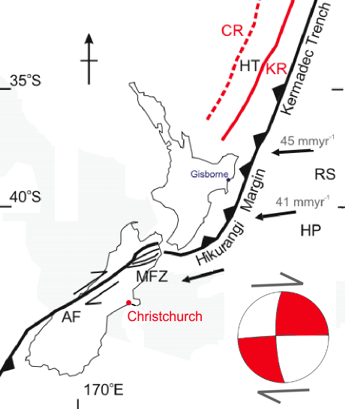
Early morning, 4 September, the city of Christchurch on New Zealand's South Island was shaken by a magnitude 7.1 earthquake. Although we don't hear of earthquakes often in New Zealand, it is in fact highly seismic area, where the Pacific and Indo-Australian plates collide. Off the east coast of North Island, the Pacific plate subducts under the Indo-Australian plate at about 40 mm a year, and off the south end of the South Island, the opposite occurs with the Indo-Australian plate subducting under the Pacific plate. Between these subduction zones lies the Alpine Fault System, a major on-land transpressive transform fault. Some of the fastest uplift rates on the planet occur in the Southern Alps as a result, with Miocene amphibolite-facies rocks in fault contact with Holocene gravel beds.
The Hikurangi margin is gradually progressing down the east coast of South Island, resulting in offset of the Alpine Fault (AF), the southernmost of which is the Marlborough Fault Zone (MFZ). Although the earthquake in Christchurch is farther south than that, the first motion studies clearly indicate that the break was on a dextral transcurrent fault, in keeping with the regional tectonic regime.
See the Highly Allochthonous weblog for lots more detail.
4 September 2010
2010 - On Track to be the Hottest Year on Record?
This summer's weather and its results have made news headlines around the world - monsoon floods in Pakistan, scorching heat in Russia, massive icebergs calving in Greenland, fires in BC, deep snow and cold in Chile, mudslides and floods in China, heatwaves in the eastern US. Is this real, or is it a product of instant news access around the world?
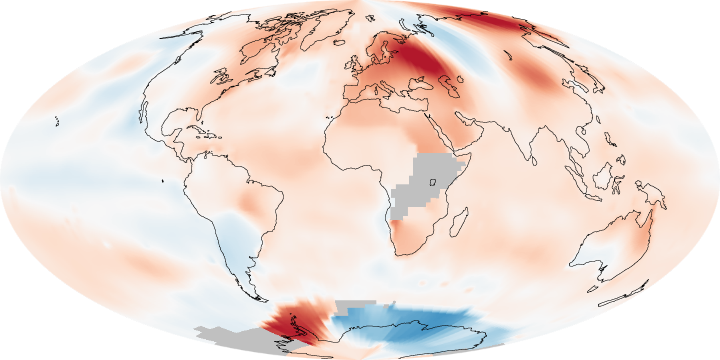
This map from the Earth Observatory shows the departure from average for the month of July. The deepest red represents an average temperature of 5 degrees or more above average, the strongest blue 5 degrees below average. The Russian heat waves (two of them - one in European Russia and one in eastern Siberia) stand out, as does the eastern US, although not nearly so strongly. Notice western Siberia had a cold month, as the jet stream dove south around it, contributing to the intensity of the Indian monsoon. Notice also the cool eastern Pacific - this is a La Niña year.
Looking at the whole year to date (January to July), from the National Climatic Data Center, the globe is undeniably hot:
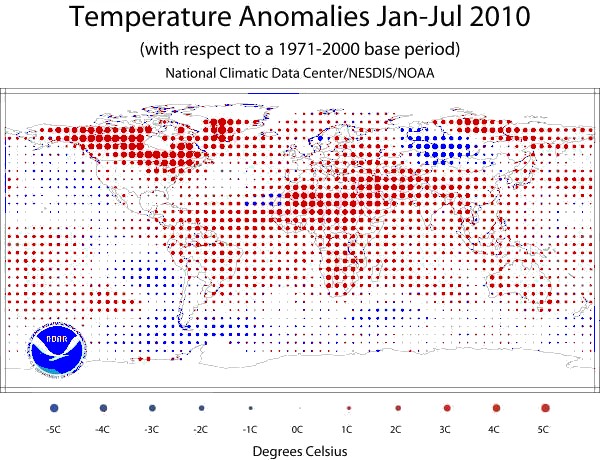
Almost all of Africa, North and South America, Australia, Europe and Southern Asia show temperatures 2-5 degrees above average, with Canada seeming to be one of the most extreme. Only western Siberia bucks the trend to any great extent - even the cooling of La Niña has only just taken the eastern Pacific into the negative range (that will increase as the effect grows toward Christmas).
Seventeen countries have set new all-time record high temperatures this year (mostly in Asia, but including also Chad, Niger, Solomon Islands, Colombia, Russia, Finland, Ukraine and Belarus), with the hottest of the hottest being Pakistan which reached 53.5°C on 26 May. For the record, Guinea was the sole country that has set a record low temperature so far this year - dipping to a chilly 1.4°C on 9 January.
Is this the effect of global warming?
Climatologists are very reluctant to state that any one year's climate
is directly the result of global warming - so many things contribute to
climate extremes, like the El Niño/La Niña events, wandering jet
streams, even solar activity, but the term being seen more and more on
climate-related blogs is that global warming "loads the dice" so that
what might be a hot year otherwise now becomes a record-setting year.
18 August 2010
La Niña has arrived
As the North Atlantic
continues to achieve record warmth, the opposite is happening in the
equatorial Pacific, where waters are cooling, and have now crossed into
La Niña conditions. Although cool water has to persist for some time
before it is classified as a La Niña event, there is every likelihood
that such conditions will persist till Christmas, normally the time when
La Niña or El Niño events peak. 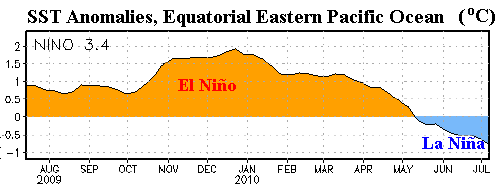
[Source: Wunderground blog]
La
Niña events typically reduce wind shear in the Atlantic, thereby
allowing the development of more hurricanes, and sometimes are
associated with colder winters in central and eastern North America,
especially if the conditions persist well into the next year. We should
expect wetter conditions in South and Southeast Asia, a hotter summer in
Australia, and drier conditions across the West Pacific.
15 July 2010
Quebec Earthquake on Acadia seismometer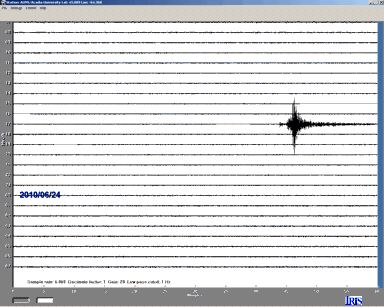 The
magnitude 5.0 earthquake north of Ottawa on 23 June was clearly picked
up by the seismometer at Acadia. Unlike many of the more distant large
earthquakes detected here, which show up with several minutes of long
wave shaking, this event was relatively brief, with an initial low
amplitude P-wave, and the main S-wave arrivals about 4 minutes later
(click on image for a larger image with arrivals identified). Such an
event would not be felt here by an observer.
This intraplate
(within a plate) type of earthquake, though not common in Canada, is not
unknown. The St. Lawrence Valley east of Montreal and the Ottawa and
Lake Champlain valleys are all graben (fault-bounded troughs) which have
been active through the past 100 million years. Their margins are still
active fault zones, although most tremors are of much lesser
magnitude. However the region from Ottawa to Quebec City and on to the
Saguenay fiord is recognised to be the second most active earthquake
zone across southern Canada (after southwestern BC).
25 June 2010
Landslides in Quebec and BC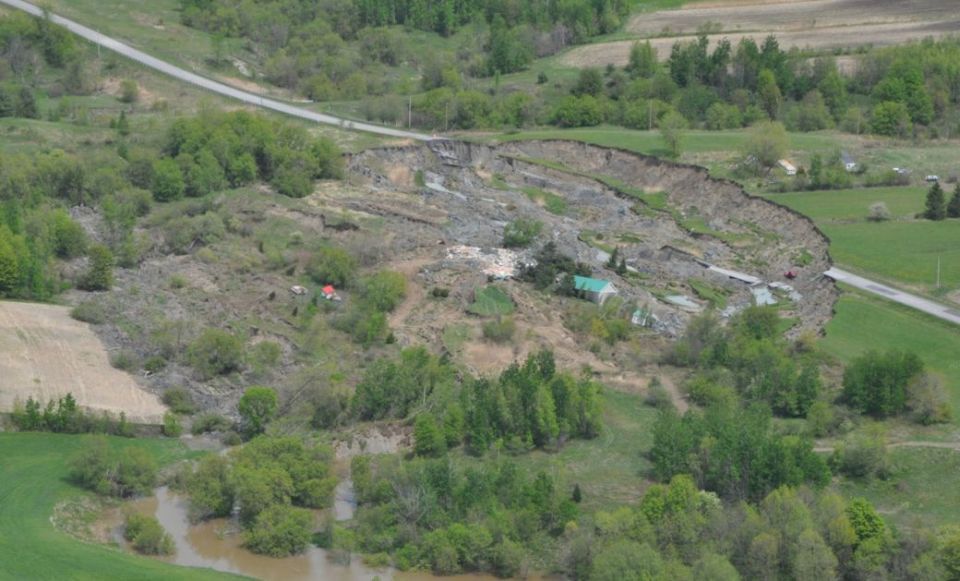 Landslides
are the most destructive geological hazard in Canada. Hundreds occur
every year, but most are in mountainous or remote areas, with little
effect on society. On 10 May, saturated ground in the St. Jude area of
Quebec resulted in an extensive landslide, which carried away a house
and killed the four residents.
This landslide occurred in an area notorious for similar events,
underlain by the Leda Clay, a thick layer of marine sediment that was
deposited when the St. Lawrence Lowlands were covered by the Champlain
Sea. The clay was deposited by flocculation from salt water, and when
the salt is leached out can become quick, especially when it saturated.
The sediment is therefore sensitive to failure even on gentle,
especially if disturbed. The St. Jude landslide happened after a period
of prolonged precipitation.
More details on the CBC website or from the Geological Survey of Canada.
21 June 2010
Eyjafjallajökull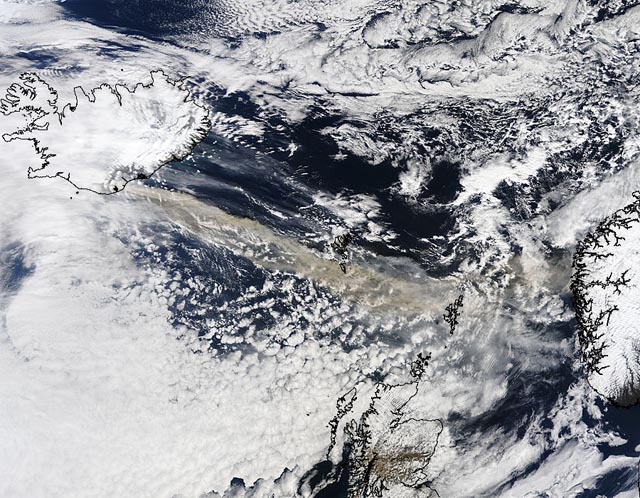 Eyjafjöll volcano continues to erupt, with major
consequences across much of northern Europe. It sent a towering cloud of
volcanic ash 6-11 km
high, which has caused a dramatic interruption of air traffic over much
of northern Europe. This disruption will spread southwards and eastwards
over the next day as the ash cloud gradually spreads and disperses.
Closer to the source, the melting of the Eyjafjallajökull Icecap has
resulted in significant jökulhlaup flooding along the south coast.
Although major volcanic eruptions have been associated with climatic
changes (typically a half degree cooling for the next 12 months), this
is mainly the case with high-sulphur explosive volcanoes in tropical
latitudes. Eyjafjöll is none of these. The current ash cloud is
significant, and will dissipate around the Northern Hemisphere and
gradually get "rained out". Should the eruption continue, it will be a
persistent nuisance to jet travel in the North Atlantic, but is unlikely
to have any other major effect outside Iceland, except perhaps enhanced
sunsets this spring and summer.
15 April 2010
Volcanic ash cloud stretching from south Iceland to Faeroes and Shetland. Image credit: NASA
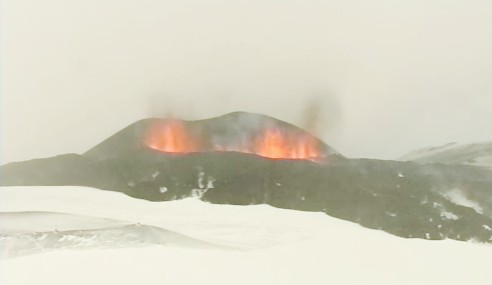 Eyjafjöll consists of an east-west-trending, elongate ice-covered
basaltic-andesite stratovolcano with a 2.5 km wide summit caldera. The
volcano began to erupt on 20 March, leading to road closures and
evacuations. The initial visual report of the eruption was at 23:52 GMT,
when a red cloud was observed at the volcano, up the sky above the
eruptive site. The eruption was preceded with intense seismicity and
high rates of deformation in the weeks before the eruption, in
association with magma recharging of the volcano. The eruption proceeded
along an east-west fissure, now joined by a south-trending fissure, and
continues to spew aa-type lava on to the ice cap. A central crater is
opening, and lava-falls have been reported falling back into it.
2 April 2010
Chilean earthquake
On Saturday morning, 27 February, 3.30 local time, a powerful magnitude
8.8 earthquake rocked the central coast of Chile, between Conceptión and
Santiago. This earthquake, likely the fifth greatest earthquake
recorded since seismologic records started in the early 20th Century,
occurred about 500 km south of the world's largest ever measured
earthquake, at magnitude 9.5, and released 500 times more energy than
the 12 January earthquake in Haiti. The zone of movement on the
subduction zone extended for 80,000 km2 (the zone of movement in the Haiti earthquake extended for 600 km2). More comparisons of these earthquakes can be found at the USGS site. As a result of this earthquake, the central coast of Chile moved 3 m west (Science News). Interestingly, this earthquake was well predicted by Ruegg et al. (2009) in an article in Physics of the Earth and Planetary Interiors (article available only inside Acadia) - they nailed the location, slip direction, even the
magnitude - everything but the timing!
6 March 2010
Haiti earthquake
Early in the evening of 12 January, local time, a major earthquake
resulted in catastrophic damage across the Port-au-Prince region, the
capital of Haiti. The quake registered loud and clear on the Acadia
seismometer, with an initial P-wave arrival at 21.58 UT, about 3
minutes later, at 22.01 UT. The long wavelength L waves began to be
received here at 22.05 UT, and continued for nearly an hour. According
to the USGS theoretical P wave travel times, these arrivals in Nova Scotia were approximately 6 minutes after the main shock was felt in Port au Prince.
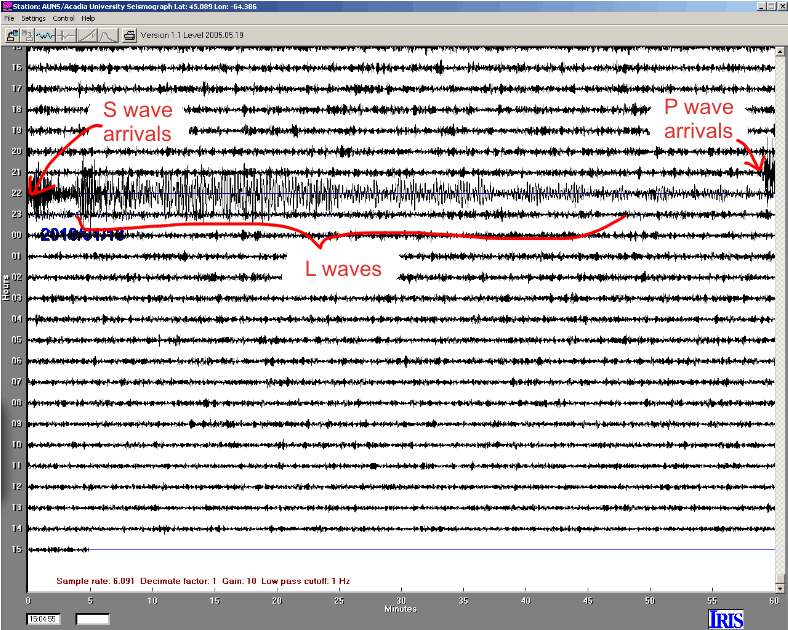
[Click on graph for larger version.]
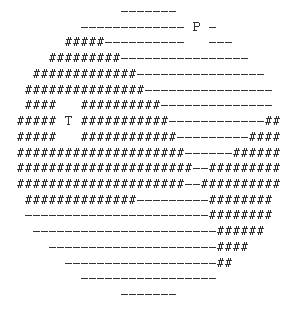
Although Haiti is better known for the devastation brought by hurricane-induced flooding, the North Caribbean Transform Fault does lie just north of Hispaniola, passing through the Windward Passage between Haiti and Cuba. The plate boundary in this area is complex, with sinistral movement partitioned between the Septentrional Fault System north of Haiti and the Enriquillo-Plantain Garden Fault on the south side of Haiti. Splays of this fault form the boundaries of both sides of the Massif de la Hotte, the long southern peninsula that makes up the south of Haiti. It appears that the earthquake occurred on one of these splays. First motion studies from the USGS show that the movement was typical of a strike-slip fault:
Damage has been particularly heavy as a
result of the 7.0 earthquake, compounded by poor building practices,
many towns and cities being sited on alluvial plains, which are
especially prone to shaking during an earthquake, and deforested slopes
which are prone to rock falls and landslides.
13 January 2010
For previously listed events see the 2008-09 events archive.

