Recent Events in our World
Check out our seismograph - updated every minute. The US Geological Survey provides up to date (at least up to the last hour) information on recent earthquakes around the world. VolcanoWorld provides the best up to date information on volcanic activity around the world.
Interesting earthquake pair across the Pacific Ocean
The seismic lab at Acadia picked up the signals from two earthquakes on 8th December 2016:
Click on image for larger version
The first event at 14.58 UT was from a magnitude 6.5 earthquake on the Mendocino Transform, west of Eureka, California. Clearly visible are the first arrival of P-waves, followed about 2 minutes later by the S-waved (right on the hour), and at 15.13 the L waves started rolling in.
The second event was a much larger magnitude 7.8 earthquake occurred in the southeastern Solomon Islands. Hitting at 04.38 local time in the Solomons (17.38 UT in graph above, 13.38 Atlantic time), the P waves arrived at Acadia at 17.58 UT, almost exactly 3 hours after the California arrival. The L waves travel slower than the P waves, and took a full 50 minutes to build to a peak at the Acadia seismometer.
9 December 2016
2016 keeps on heating up
Half way through 2016, it appears we are heading into the record books yet again. Every month in 2016 has resulted in record high temperatures for that month, in part a result of the declining El Niño, and in part by the boost provided by 21st century global warming. Now that El Niño is over, we might expect a return to normal, but such is not the case with over 90% of the globe warmer than average, and the only areas cooler than average are so because of especially strong precipitation. Even the North Atlantic cold pool south of Greenland has practically disappeared. Conditions are so warm that NOAA and NASA have issued a first semi-annual assessment, revealing that the global temperature has now exceeded the long term average by more than 1 degree C.
2015 - Hottest Year on Record
The NOAA analysis for 2015 places the year as the hottest on record. Data from around the world shows nearly ubiquitous above-normal temperatures, with almost 20% of the globe experience record temperatures over the full year.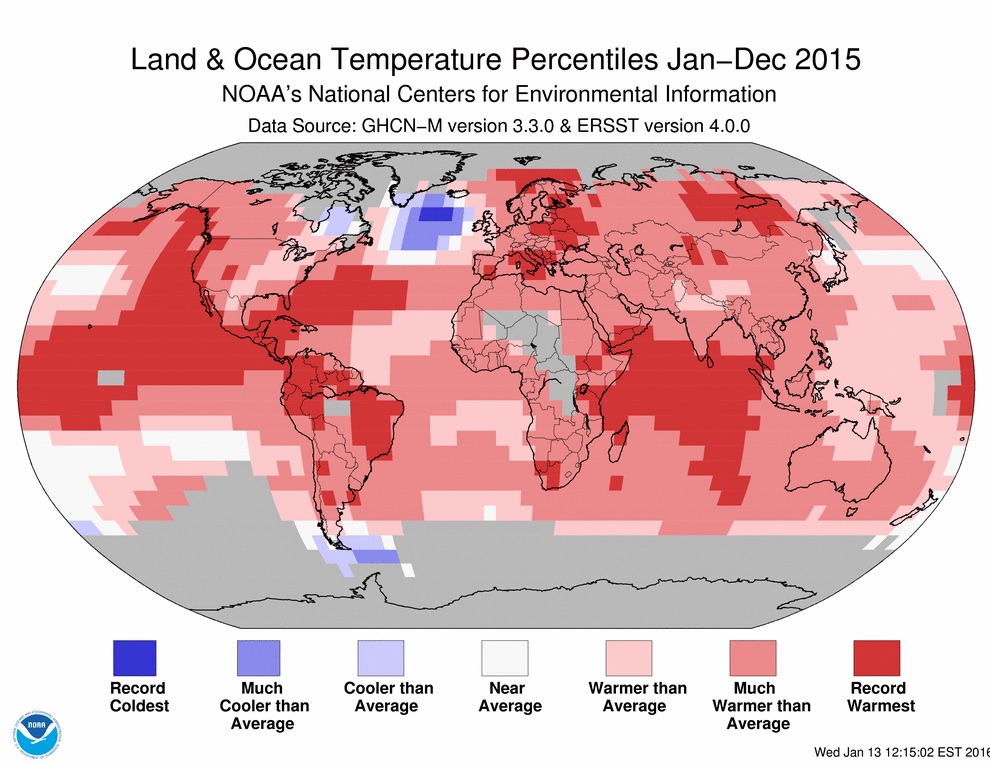
Image credit: NOAA/NCEI.
The sole exception to this global hothouse is a small part of the North Atlantic Ocean, south of Iceland, referred to as the "cold blob". Its origin is still uncertain - it might be caused by increased melting of Greenland or Arctic Ocean ice, or accelerated outflow of Arctic Ocean water, or a slow-down in the Atlantic Meridional Overturning Circulation (the AMOC). This current transports heat north through the North Atlantic, via the Gulf Stream and related currents. Completing the loop, dense surface water, generated near the surface in the Labrador Sea sinks and flows southward.
Source: Weather Underground
Earthquake in Nova Scotia
A magnitude 3.4 earthquake was felt over parts of western Nova Scotia on 1 July 2015. Reports of people feeling the motion came from Yarmouth and Digby counties, and the epicentre was located just west of Cape St. Mary at the mouth of the Bay of Fundy. The hypocentre was at a depth of 5 km. This tremblor follows two magnitude 2 events in the same general area in June. People who felt it reported sensations like thunder, a snowplough going by, or like a train passing, but the movement continued for up to 60 seconds.
The earthquake was detected on the Acadia seismometer:
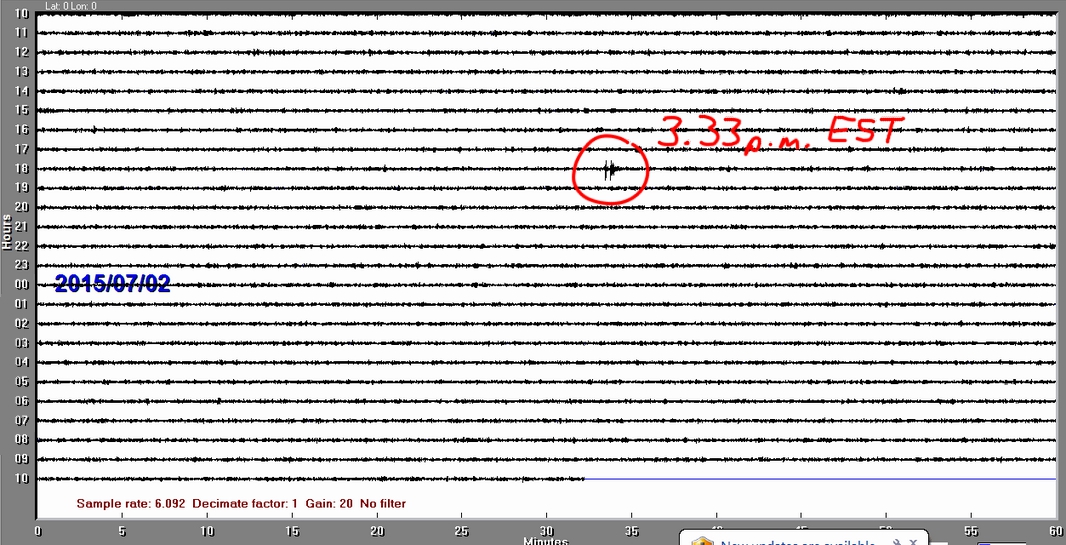
[Click on image for larger version]
Two events were identified at 3.33 p.m. local time, presumably the passing of the P and S waves. No damage was reported from this event.
2 July 2015
Northern Hemisphere's warmest winter
Following the closure of meteorological winter (Dec-Jan-Feb) 2014-15, the statistics reveal this was the warmest winter on record. Those of us in eastern Canada may wonder about that, as many parts have experienced a record cold February, but the global map speaks for itself:
Almost the entire globe snows "warmer" or "much warmer" conditions, even for February, and some parts of the western side of North America were "record warmest". This is all the more remarkable as it occurred in a winter when an El Niño was not in operation.
23 March 2015
Earth's Hottest Summer

Both the month of August 2014 and the June-August summer period of 2014 have been pronounced as Earth's warmest since records began in 1880 by the National Climatic Data Center (NCDC). NASA also rated August 2014 as the warmest August on record. Global ocean temperatures during August 2014 were also the warmest on record, and the 0.65°C ocean temperature anomaly was the highest ever measured, beating the record set just two months ago in June. The average temperature for the first 8 months fo 2014 is 0.68°C above 20th century average. 2014 is on track to be the warmest year on record if these trends are maintained.
19 September 2014
A cold winter?
We have all been commenting on how severe this winter has been - storm after storm, and deep cold. But has it really been all that cold? NOAA has released its analysis of global temperatures for January:
Notice that much of the planet shows above normal conditions - the Southern Hemisphere had its hottest January ever recorded, and the planet as a whole its fourth-warmest January. Large parts of South America, South Africa and the Pacific have seen record warmth, and only a few areas fall into the "much cooler than average" category, eastern North America being one of them.
24 February 2014
So few hurricanes?
People are asking why have we heard so little about hurricanes this summer? Doesn't a warmer climate promote hurricane development? Yes it does - but: several things contribute to destroying them before they get big, and many of these have been operative this summer. A large area of high pressure has been blocking the movement of systems from the African coast; strong wind shear in the usual hurricane development belt has been ripping them apart; and winds across the Atlantic have been somewhat suppressed. Most importantly, though, dry air has been pouring off the Sahara Desert, reducing atmospheric humidity, without which hurricanes cannot intensify.

Most Cape Verde-type hurricanes (the ones that can close to Nova Scotia) form in the line of waves west of the bulge of Africa, but north of that the extensive swath of yellow and orange denotes drier and dustier air, which suppress their development. More details on the Wunderground site.
4 September 2013
When will it be spring?
That's a question a lot of people have been asking recently, as it seems that winter has dragged on well into April. However, the reality is that we have had a normal, or even slightly warmer than normal winter. Our problem, of course, is that we have enjoyed some relatively mild winters recently, and last year that 25 degree heatwave in March.
The NOAA summary of temperatures for March shows Atlantic Canada as a bit of a hotspot, and the rest of Canada as rather normal. Cold weather in eastern USA and Europe has grabbed much of the headlines, with persistent snows in Britain and the Mississippi Valley, but large areas of the tropics, China and the Southern Hemisphere has ensured that March 2013 is the 11th warmest on record.
24 April 2013
7.7 Magnitude Earthquake in Haida Gwaii
The second largest earthquake ever recorded in Canada occurred on Haida Gwaii on October 28th, 2012 (October 27 on Haida Gwaii). The Acadia seismograph picked up the seismic trace clearly:

Quoting the USGS website:
The M 7.7 earthquake south of Masset, Canada, occurred as a result of oblique-thrust faulting near the plate boundary between the Pacific and North America plates. At the location of this event, the Pacific plate moves approximately north-northwest with respect to the North America plate at a rate of approximately 50 mm/yr.
This earthquake is likely associated with relative motion across the Queen Charlotte fault system offshore of British Columbia, Canada. Studies of tectonics in this region suggest plate motions are taken up by strike slip faulting parallel to the plate boundary, accompanied by lesser amounts of thrust motion to accommodate the oblique nature of the plate motion vector between the two plates with respect to the orientation of the main plate boundary fault structure. This oblique component of plate motion may involve either underthrusting of the western edge of the Pacific Plate beneath North America, or be taken up on crustal faults within the North America plate. The October 28th earthquake is consistent with either scenario.
This region of the Pacific:North America plate boundary has hosted 7 earthquakes of magnitude 6 or greater over the past 40 years – the largest of which was a M 6.6 earthquake in 2009, 80 km to the south east of the 2012 earthquake. In 1949, a M 8.1 earthquake occurred closer to the Pacific:North America plate boundary, likely as a result of strike-slip faulting, approximately 100 km northwest of the October 28th earthquake, near the northern extent of Haida Gwaii region (formerly Queen Charlotte Islands).
28 October 2012
Record Minimum Arctic Sea Ice

Arctic sea ice extent has now reached its lowest for the entire 35-year available satellite record, according to the National Snow and Ice Data Center (USA). The record was reached on 26 August, three weeks before the usual end of the melting season, and the area has continued to drop since that date. A 2011 study by Kinnard et al. shows that the Arctic hasn't seen a melt like this for at least 1,450 years. The latest September 18, 2012 extent of 3.5 million square kilometres represents an approximately 50% reduction in the area of Arctic covered by sea ice compared to the average from 1979 - 2000. The extent of ice reaches a minimum in mid-late September, so it should start to increase within the next week or two. However, the open water over the Arctic will provide extra heat and moisture to the atmosphere over the next few months that will likely affect weather patterns with an increase in the intensity and duration of extreme weather events during fall and winter.
When was Arctic sea ice lasts this small? Ships periodically attempted the Northwest Passage through the past 400 years and almost all (except icebreakers) were unsuccessful. It is very unlikely the Northwest Passage was open between 1497 and 1900, since this also spanned the Little Ice Age. Kinnard et al. (2011) have shown that the Arctic ice melt in the past few decades is unprecedented for at least the past 1,450 years. The last time so little summer ice was present in the Arctic was 6000 years ago. Funder and Kjaer (2007) found extensive systems of wave-generated beach ridges along the coast of North Greenland, suggesting that the Arctic Ocean was ice-free in the summer for over 1,000 years between 6,000 and 8,500 years ago. This was when Earth's orbital variations (Milankovitch cycles) brought more sunlight to the Arctic in summer than at present. Prior to that, the next likely time would have been during the Sangamon inter-glacial period, 120,000 years ago, when Arctic temperatures were 2-3°C higher than present-day temperatures, and sea levels were 4-6 metres higher.
18 September 2012
A busy day in the seismic lab

Six earthquakes in one day were recorded on the Acadia seismograph. At the top of the day's record are the two M8 earthquakes west of Sumatra, followed by an M6 earthquakes west of Oregon and in the south of Mexico. Overwhelming the record is trace from an M7 tremor in the Gulf of California, and if you look carefully you will see the record of a small M4.5 tremor 200 km south of Yarmouth. The strength of the record depends on the strength of the earthquake and how far away the earthquake occurred.
[Click here for a larger image without the labels.]
12 April 2012
The winter that isn't? It depends on where you are.
Many people are commenting on the winter that isn't this year. We have had a few short cold spells, but many mild spells, often accompanied by rain, and as a result no deep snow (although did you forget about that 42 cm snowfall back in November, that melted away in 15 degree rain two days later?) All across Canada and the USA it seems people are remarking on the mildness of the winter. Is it true? It depends where you are
The National Climatic Data Center compilation of temperature anomalies shows that North America did indeed experience an abnormally warm January - up to over 5 degrees above normal in the centre of the continent. However, Alaska was 6-8 degrees below normal, and central Asia similarly had a cold month. Recent weather reports from Europe have recorded record cold from England to Turkey, with deep snow along the Mediterranean, so no doubt a February compilation would look very different. What the anomaly map shows is a normal winter - cold in some places, warm in others, although the degree of warming in the more northern areas might be remarkable.
16 February 2012
Virginia Earthquake, 23 August 2011
In the afternoon of 23 August, millions of people on the US East Coast, and parts of Canada witnessed one of the most severe earth tremors in the eastern half of the continent in over 100 years. The epicentre was in Virginia, and minor structural damage was reported in cities like Washington, Baltimore, Norfolk and Richmond. Ground shaking was felt as far away as New England and Ohio, and even in Toronto and Fredericton, buildings located on fill that amplifies the seismic waves had noticeable effects - water sloshing in coolers, pictures moving on walls, cords rattling against window frames. The seismograph at Acadia showed an impressive response:

The small tremor at 0615h was a 5.3 earthquake in Colorado; the 5.8 Virginia earthquake is at about 1755h, only 4 minutes or so after it happened in Virginia. The initial P and S waves are clearly visible, and the L waves continued for over half an hour.
24 August 2011
Sendai Megathrust Earthquake, Japan
The devastating Sendai earthquake has provided some remarkable statistics. At magnitude 8.9, it is certainly in the top 10 for earthquake magnitude, likely in the top 5. For the first time in recorded history two top 10 earthquakes have occurred in successive years (the other being the Concepcion earthquake, Chile, last March). The US Geological Survey reported that at least one GPS station has moved 2.5 m to the east, consistent with observations of the Japanese Geospatial Information Authority that shows a large area of Honshu has been displaced. It has been estimated that the earthquake has shifted the Earth on its axis by as much as 10 cm. The earthquake appears to have caused a rupture along an area about 400
km long by 160 km wide, as the Pacific plate slipped more than 18 metres under the Okhotsk extension of the North American plate, which extends as far south as Tokyo.
 |
First motion observations reveal two possible fault planes, one
dipping steeply to the east and one at a shallow angle to the west. The
latter is consistent with a shallow-dipping subduction zone thrust fault
system.
The extent of the large zone of slip is evident on the map which shows the location of the main earthquake (yellow) and the aftershocks received in the subsequent 30 hours. |
 |
The Acadia seismograph recorded the earthquake, when the first motions
arrived here at 4.58 UT (1.58 AT). Note also the foreshock at 17.25 UT -
this was a magnitude 7.2 event. 12 March 2011 |
Earthquakes in New Zealand
The city of Christchurch on the South Island has been rocked again by a significant earthquake. Most Geology students know that New Zealand sits on the Pacific-IndoAustralian plate boundary, and is tectonically active, but that most of the seismic activity is focused on the Alpine Fault, 150 km west of Christchurch. The city sits on the broad Canterbury Plains, river outwash from the rapidly rising Southern Alps. Just south of the city sits the Banks Peninsula, a pair of deeply dissected basaltic shield volcanoes, active 10 million years ago.

[Click for larger image.]
The September 2010 earthquake occurred well to the west of the city. The February 2011 earthquake, however, had an epicentre on the southern edge of the city, adjacent to the Banks Peninsula. Even though it is commonly reported as an "aftershock", and was a weaker earthquake, far more damage was done because of proximity to the city, the magnifying effect of the soft sediment upon which the city is built, and possible reflections of seismic waves of the hard mass of the volcanic rocks of the Banks Peninsula.
See the Highly Allochthonous blog for lots of detail about this event.
2 March 2011
2010 - the hottest-equal year in recorded history
The numbers have been crunced by NASA and by the National Oceanic and Atmospheric Administration (NOAA) and show that 2010 was tied with 2005 and nearly tied with 1998 as Earth's warmest year in recorded history (since 1880). In 2010 the average global temperature was 0.62°C above the 20th century average. Many subsets of the data also demonstrate the exceptional heat of 2010: the Northern Hemisphere's warmest year on record, the Southern Hemisphere's 6th warmest, the 2nd warmest year on land masses, the 3rd warmest year on oceans. These records are all the more significant for at least on two counts, major forces were at work to ensure 2010 would not be especially warm - the sun is currently at the low point in its solar output (sunspot) cycle, and the Pacific Ocean is experience a moderate-high level of La Niña conditions.

The La Niña effect can be seen by the broad cool region extending
across the southeastern Pacific, but the eye is drawn to the hot red
colours across most of the Northern Hemisphere (remember those Russian
heatwaves last summer?) and the extreme warmth of eastern Canada,
corresponding to open ocean conditions even into January, 2011 in parts
of the Arctic.
Since so much warming occurred in what should have
been an abnormally cool year, one wonders what the Earth will do when
the sun's output increases in 2014-2015, especially if that coincides
with an El Niño?
For more details, see Jeff Masters' blog.
17 January 2011
For previously listed events in 2010, please go to the Recent Events archive.